Finding a nice place to live with open data and QGIS
How would you look for a charming city which has a middle school, allows you to live without using a car, preferably located close to the ocean or a train station?
Update:
We landed in Nort-sur-Erdre, which we didn’t know at the time but perfectly matched our criteria!
Everyday things are accessible in less than 10 minutes walking:
- Middle School, workplace of my wife
- Coworking space, my workplace
- Local food markets
- Train station, allowing us to reach a big city (Nantes) in 37 minutes
- Climbing gym
- Public library
We still live without owning a car. The unexpected problem was to find a house in the city center in less than two months…
My wife is currently working as a teacher in a high school. She is new to this job and does not have a permanent position yet. As she isn’t sure to stay in the same high school next year, the administration asked for a list of whished school or cities for next year.
The process is not individualized, everyone can make up to thirty wishes of school or cities. Some algorithm then assigns people to places depending on points, computed from things like family location or years of services. It is not like if you could ask the inspector (nor Google) for “any small city close to the ocean.”
Let’s try to optimize our chances by mapping freely accessible data and actually list thirty cities meeting our features checklist! Here is the end result, click for the full map:
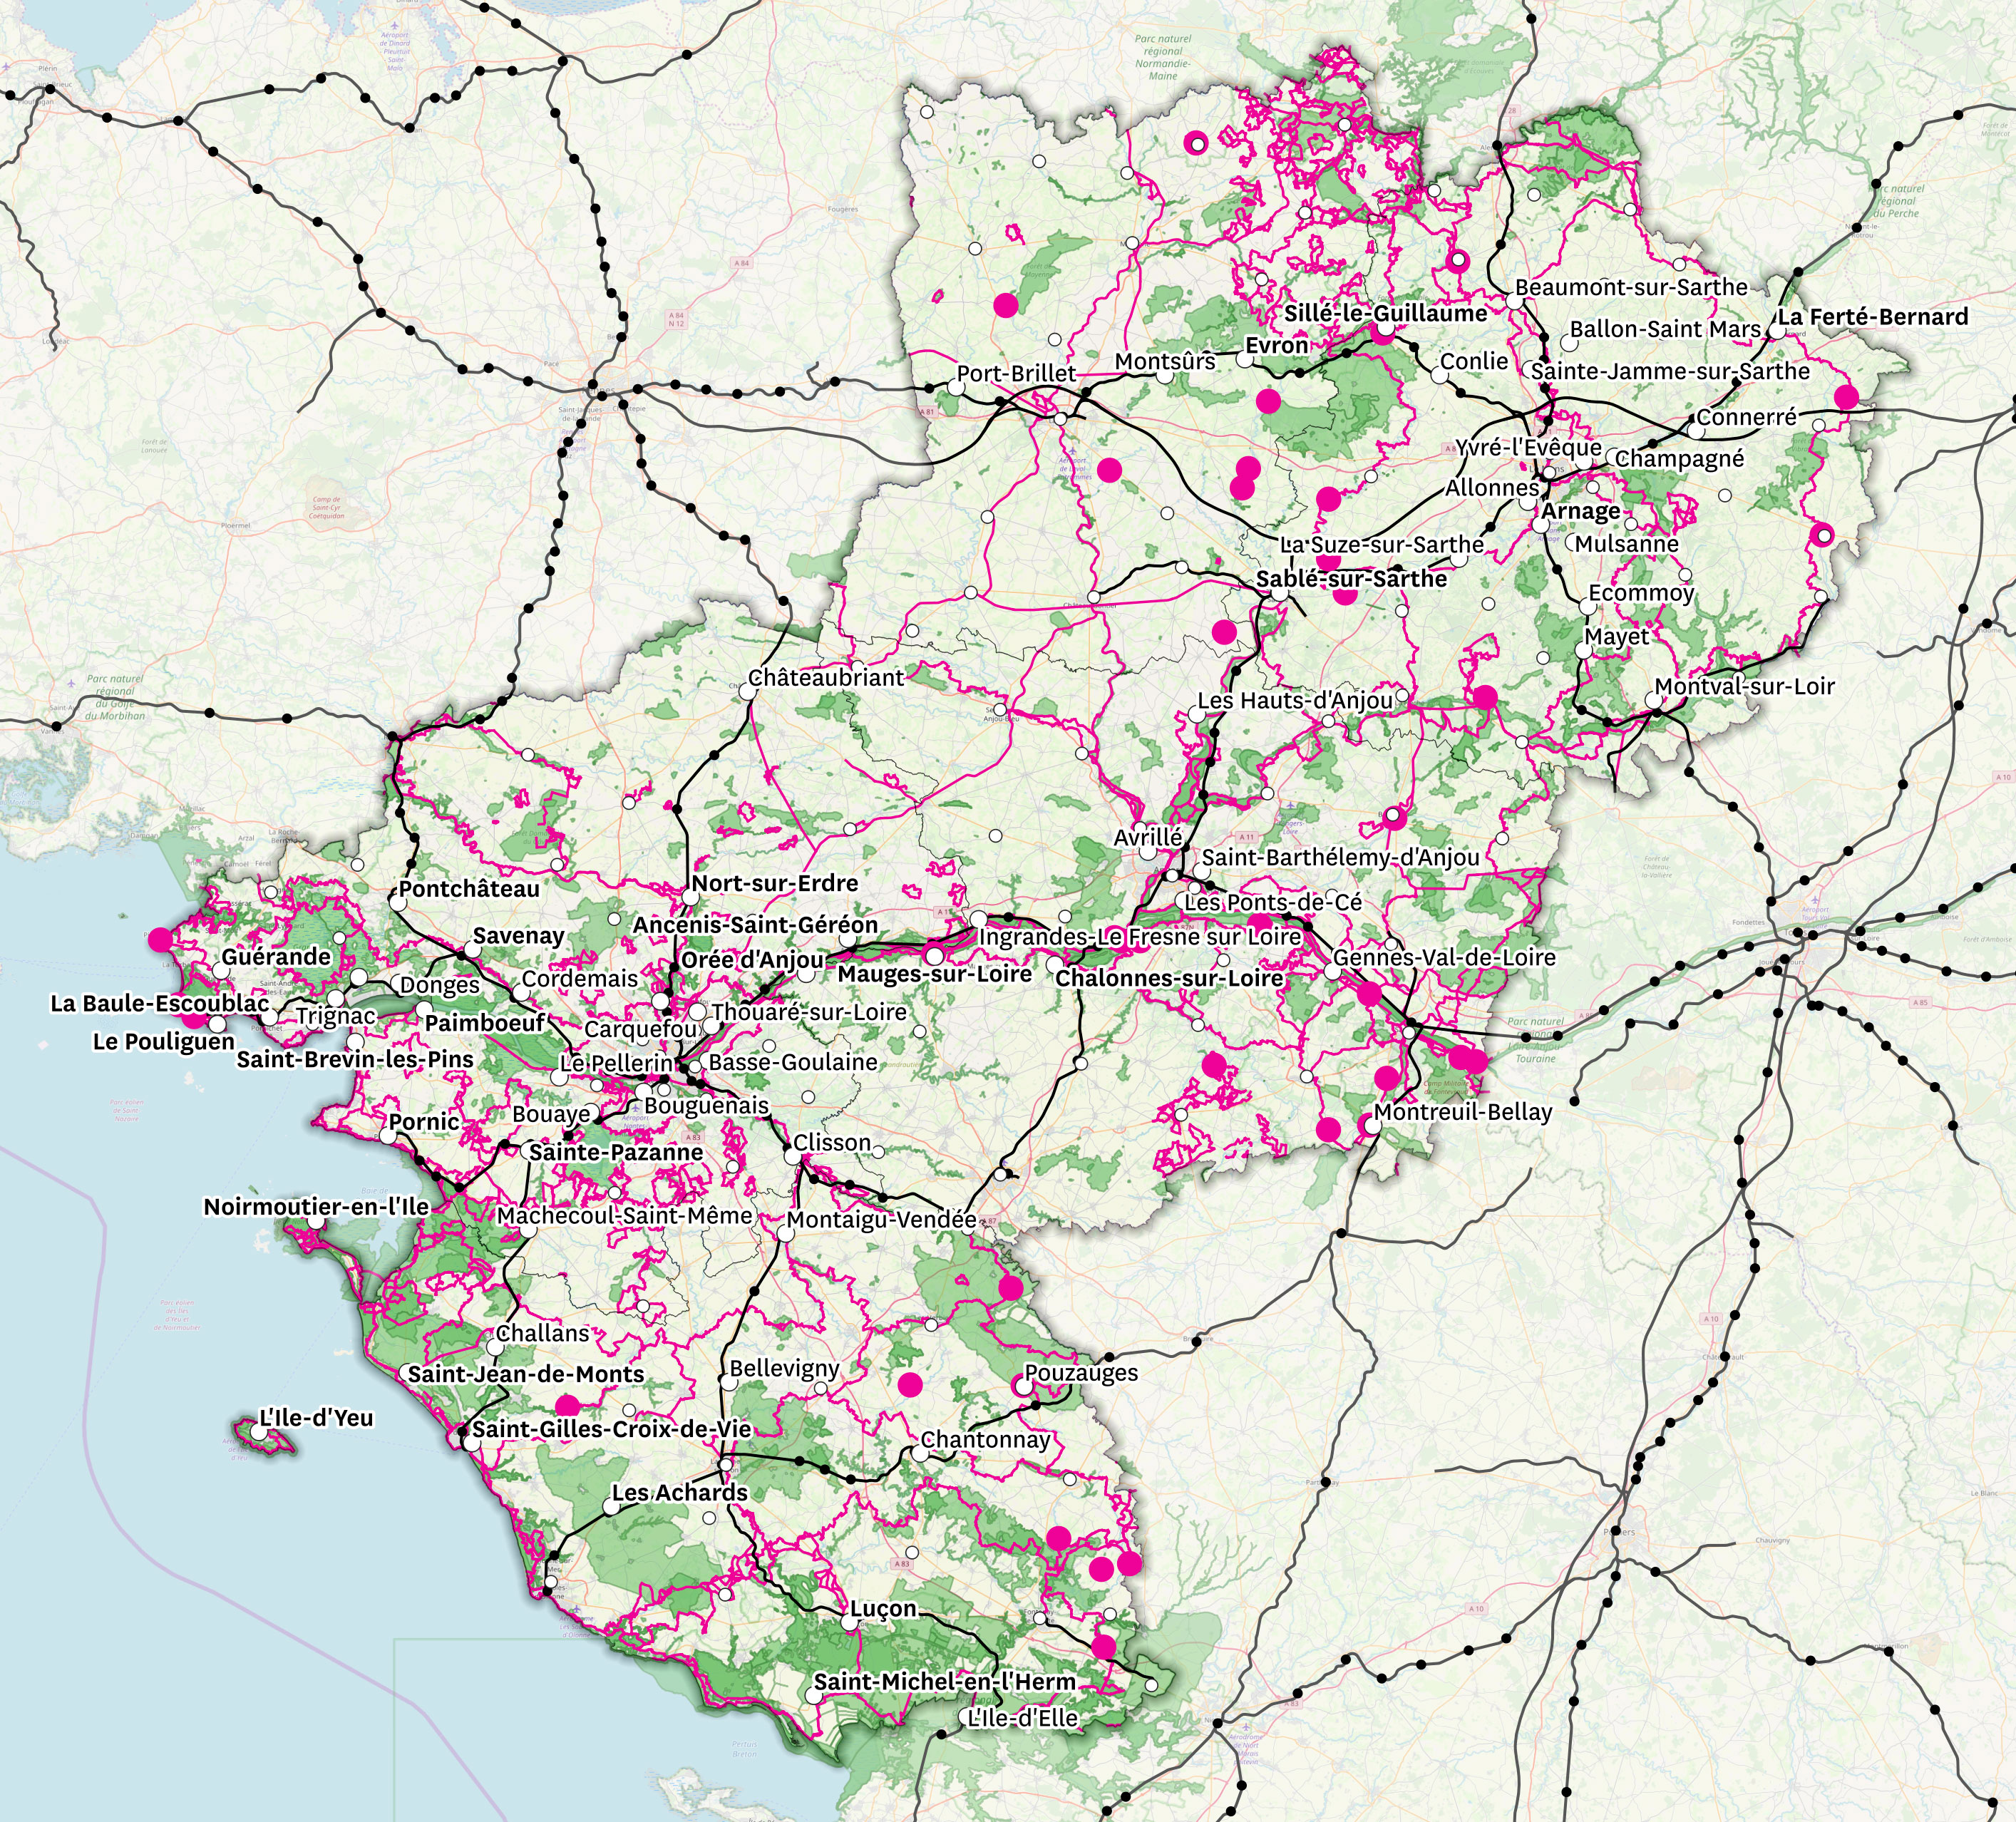
It lists small cities that we might be able to live in without having to use a car:
- Cities having at least one high/middle school are shown with a white dot
- Cities are labeled when:
- having fewer than 20 000 inhabitants
- being close to a train station or close to the ocean
- Labels are shown in bold when a city meets the previous criteria while having more than 15 activities within 2 km of a school. Like a pool, a public library, a restaurant or a local market.
- Natural zones of particular interest are shown in green.
- Biking and hiking paths are shown in magenta.
- Small charming cities are shown with magenta circles, whether or not they have an applicable school.
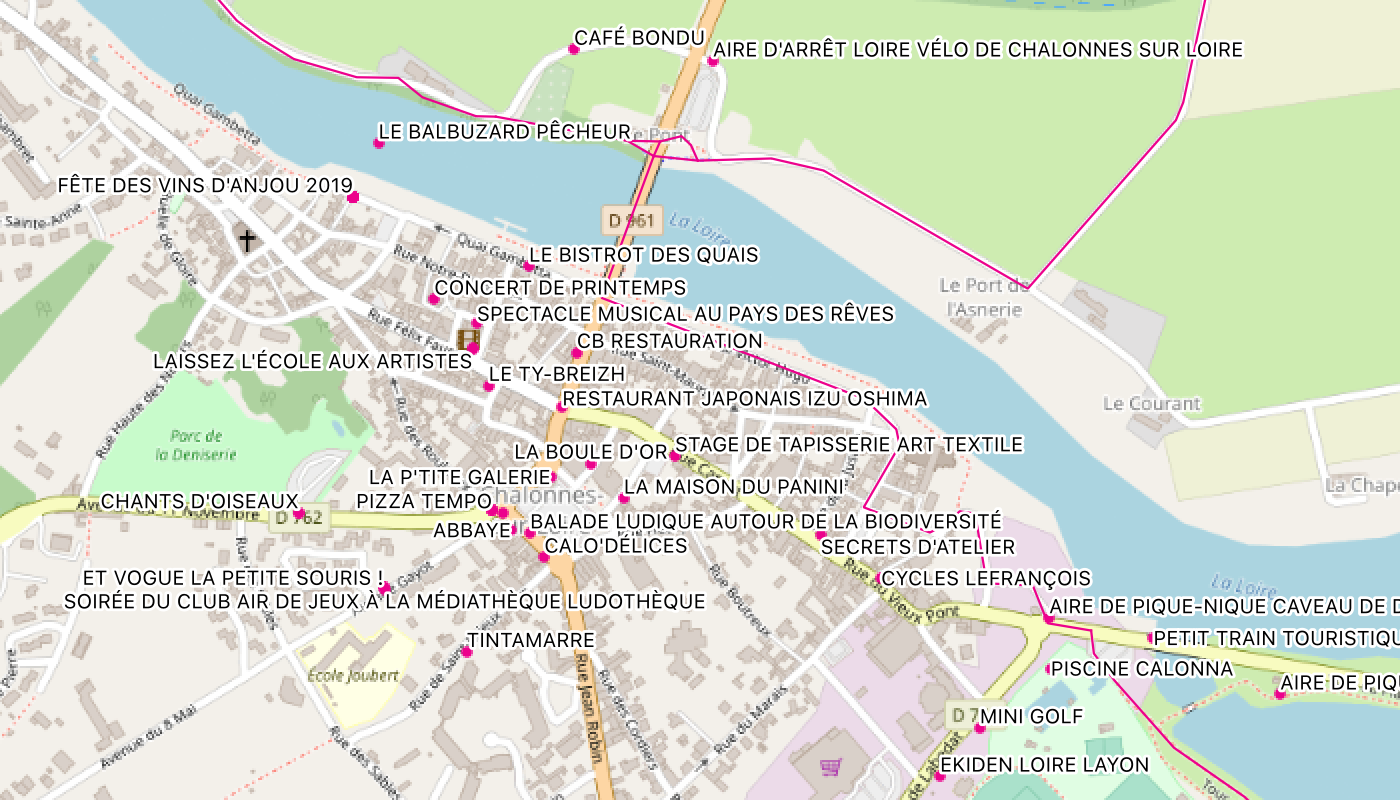
The zoomed out map names good candidates. Activities are displayed when zooming in, on top of an OpenStreetMap background, to get details about a specific city.
Impressions
- I thought that the process would have been a lot more tedious. I didn’t even have to write python scripts to reformat the data before importing it. This was the only thought I kept of some similar experiment I did some years ago.
- It feels good to handcraft your own map, definitely makes me want to print a big one.
- It feels odd to make choices depending on arbitrary thresholds and data sources:
- We set the thresholds to include or exclude particular cities we knew.
- Institutions of the populated, dynamic or touristic areas produce more data. For instance, biking and hiking paths had to be taken from OpenStreetMap since it was not produced by every department’s institutions.
- Let’s not worry about that too much since the selection process also feels arbitrary. Displaying cities that weren’t meeting our criteria allowed to put some of them in our wishes.
Setup
We will use:
- QGIS 3.6, an open source geographic information system (GIS) available on Windows, macOS and Linux
- Data.gouv.fr, pointing to institutional data (in French)
- OpenStreetMap, a collaborative map of the world
Display an OpenStreetMap background
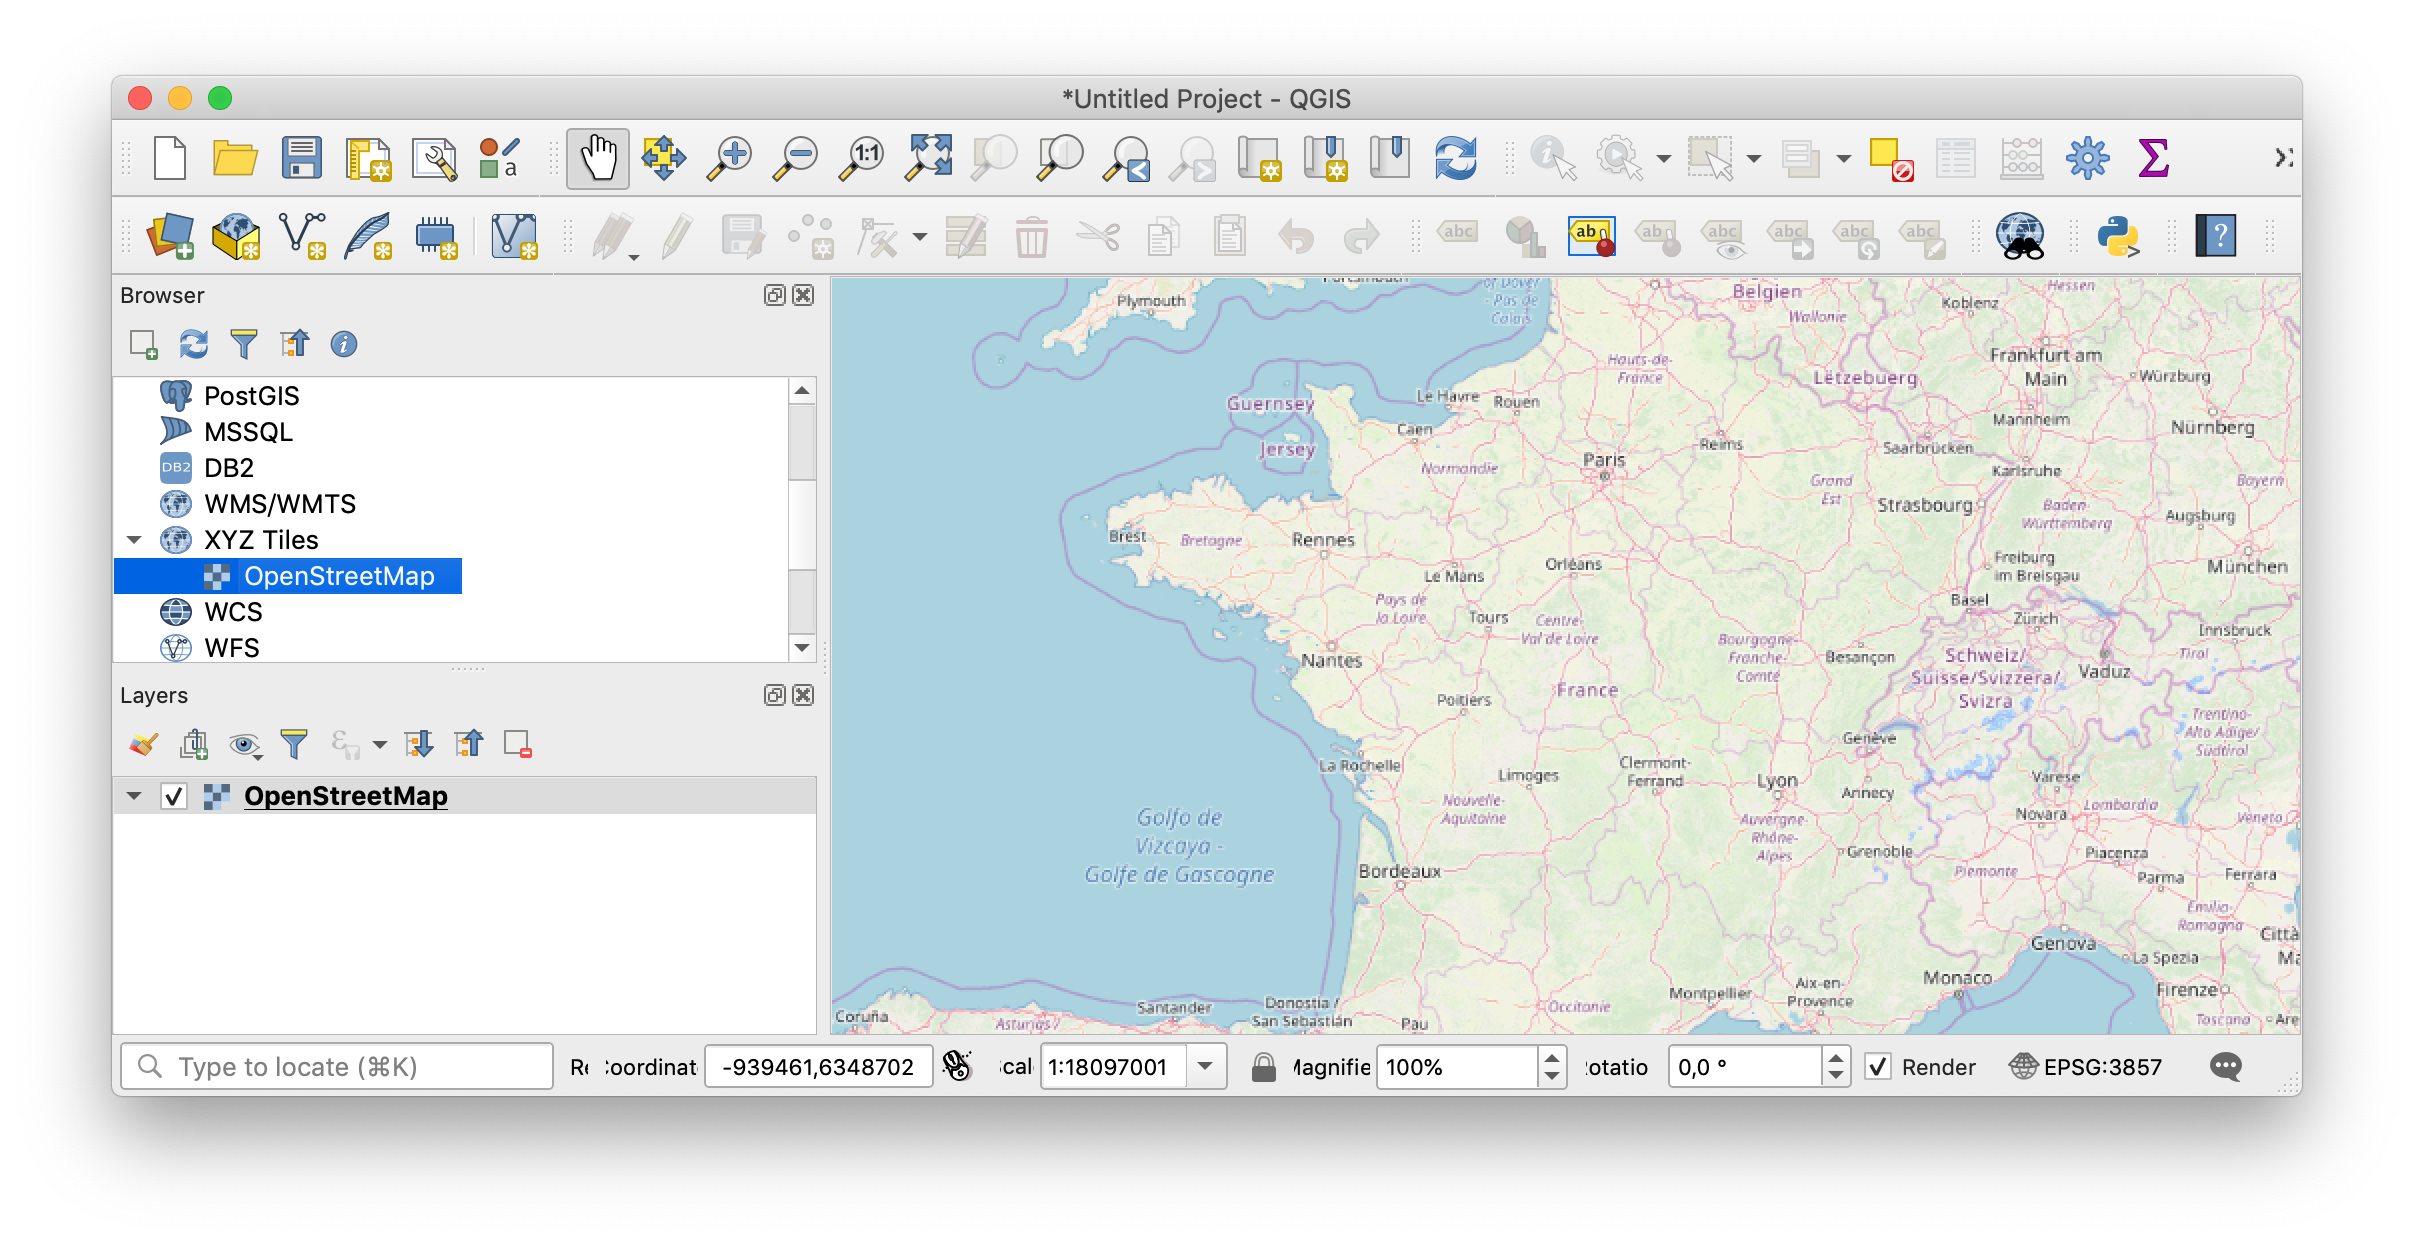
After creating a QGIS project, you will land on a blank window. Double click on the Layer Panel / XYZ Tiles / OpenStreetMap to set a map background.
This will allow you to check if the imported data align properly on a reliable map.
Import delimited text data
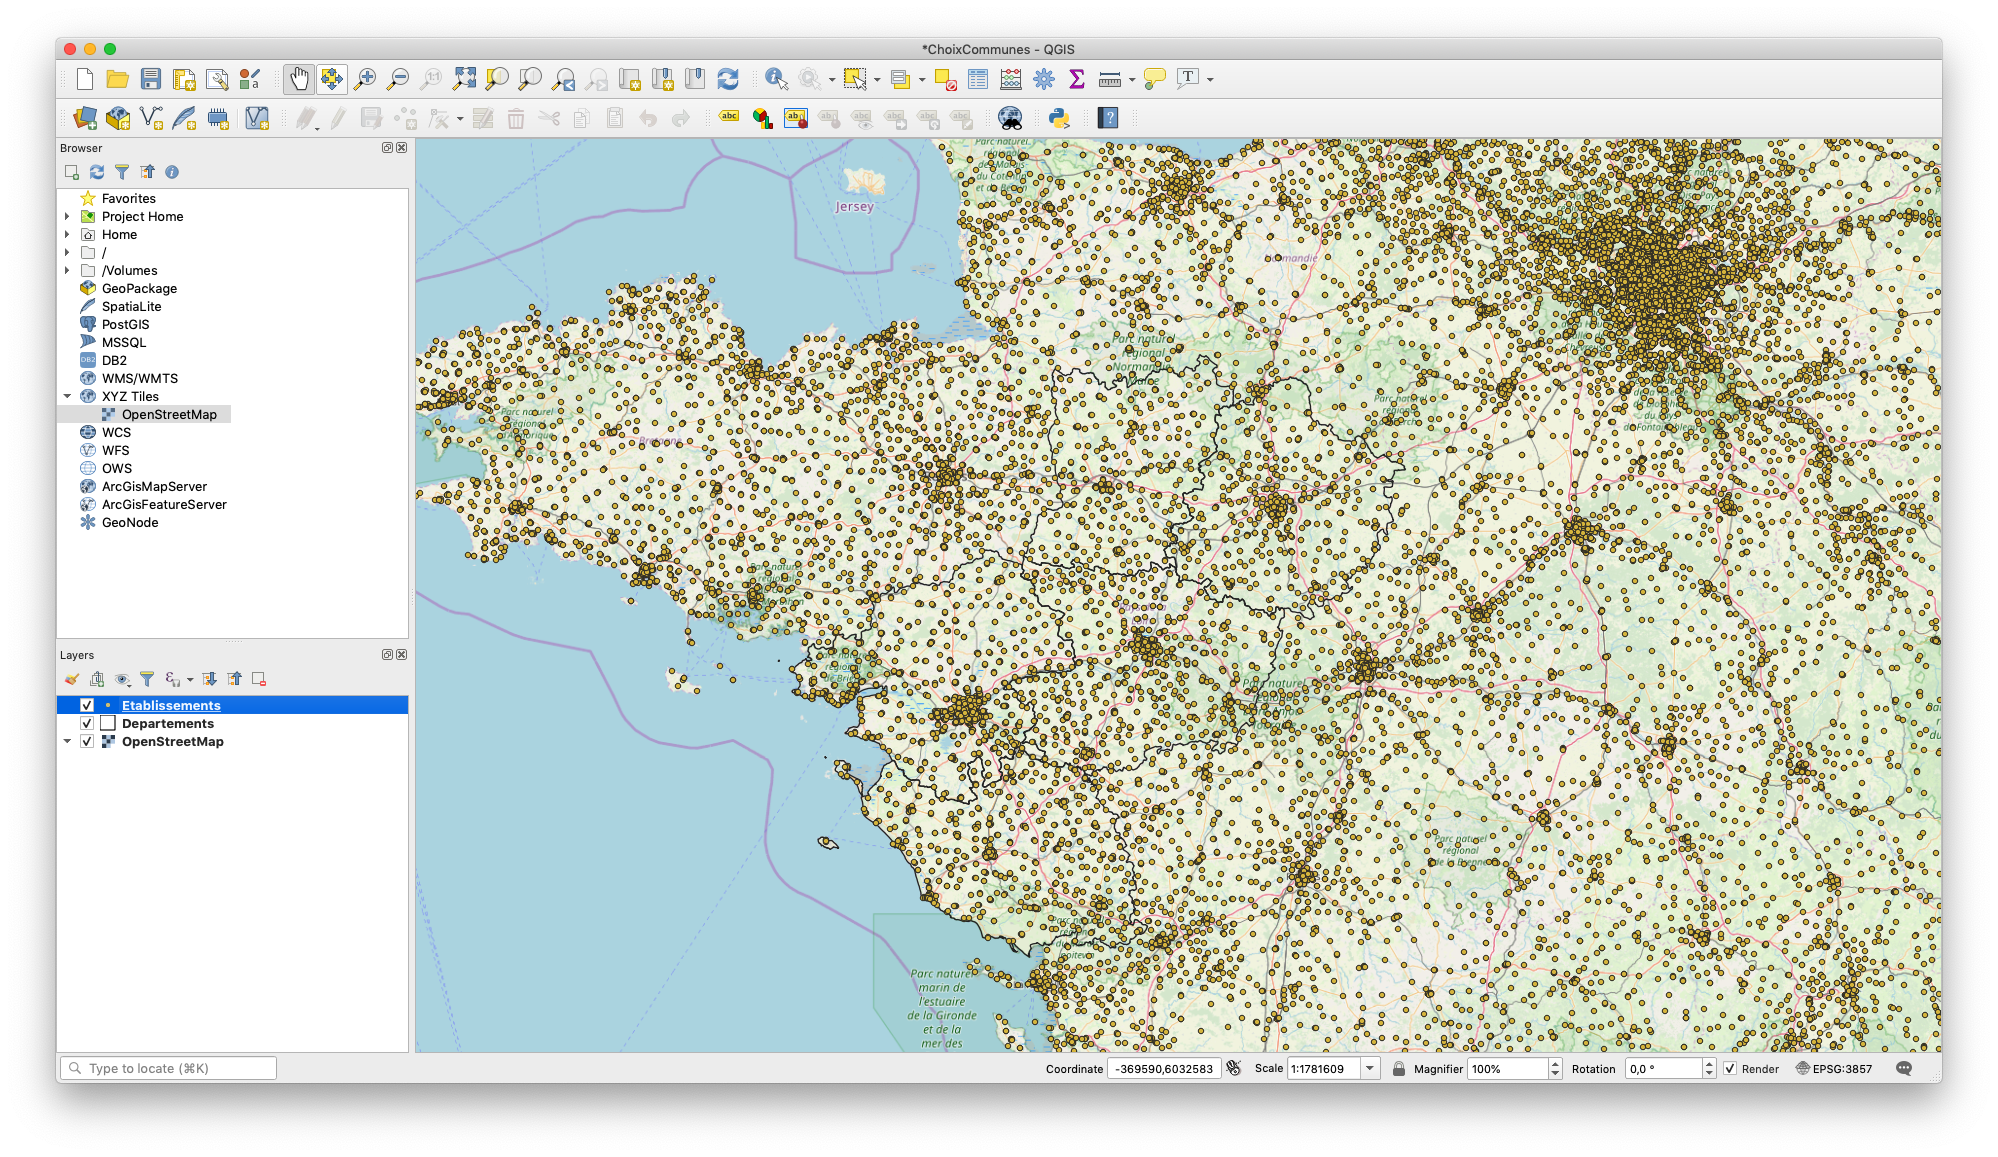
Let’s start by importing a list of schools:
- Download the data as CSV.1
- Click
Layer / Add Layer / Add Delimited Text Layer...to load the CSV file.
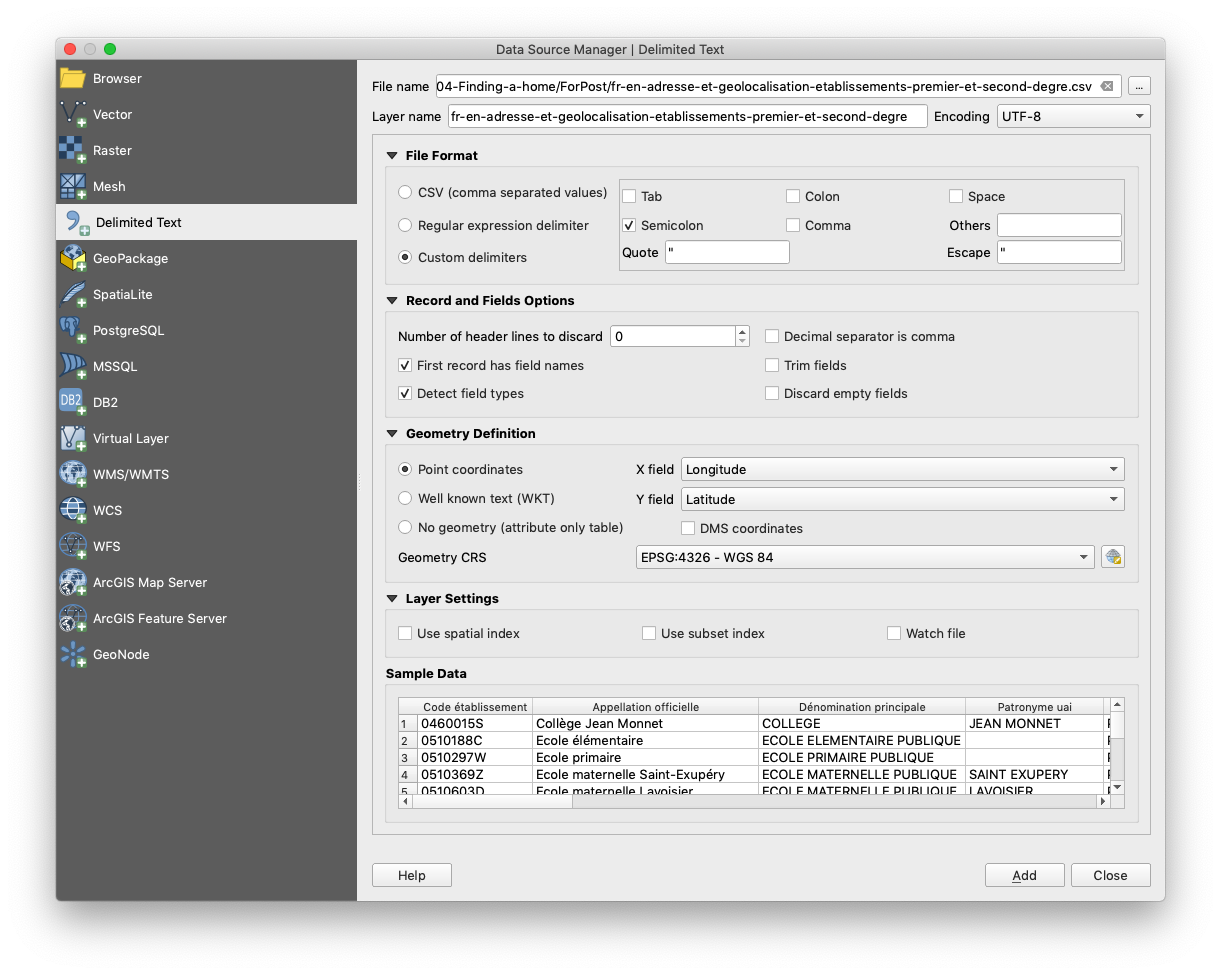
- Check that
Sample Datalooks good. - Check that
Geometry Definitionis set to sensible things like the longitude and latitude fields. I didn’t bother with the geometry coordinates reference system parameter. I found some datasets that didn’t include the geometry definition the way QGIS wanted it. To avoid those problems I guess it is better to use geographical files like GeoJSON or Shapefile instead of delimited text data. - Click on
Add.
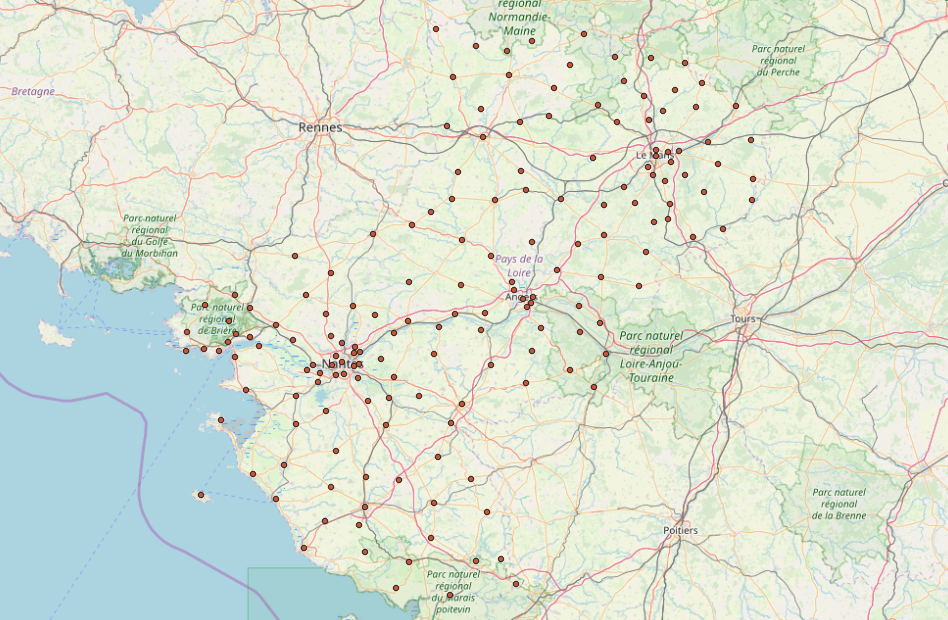
Grouping schools by cities
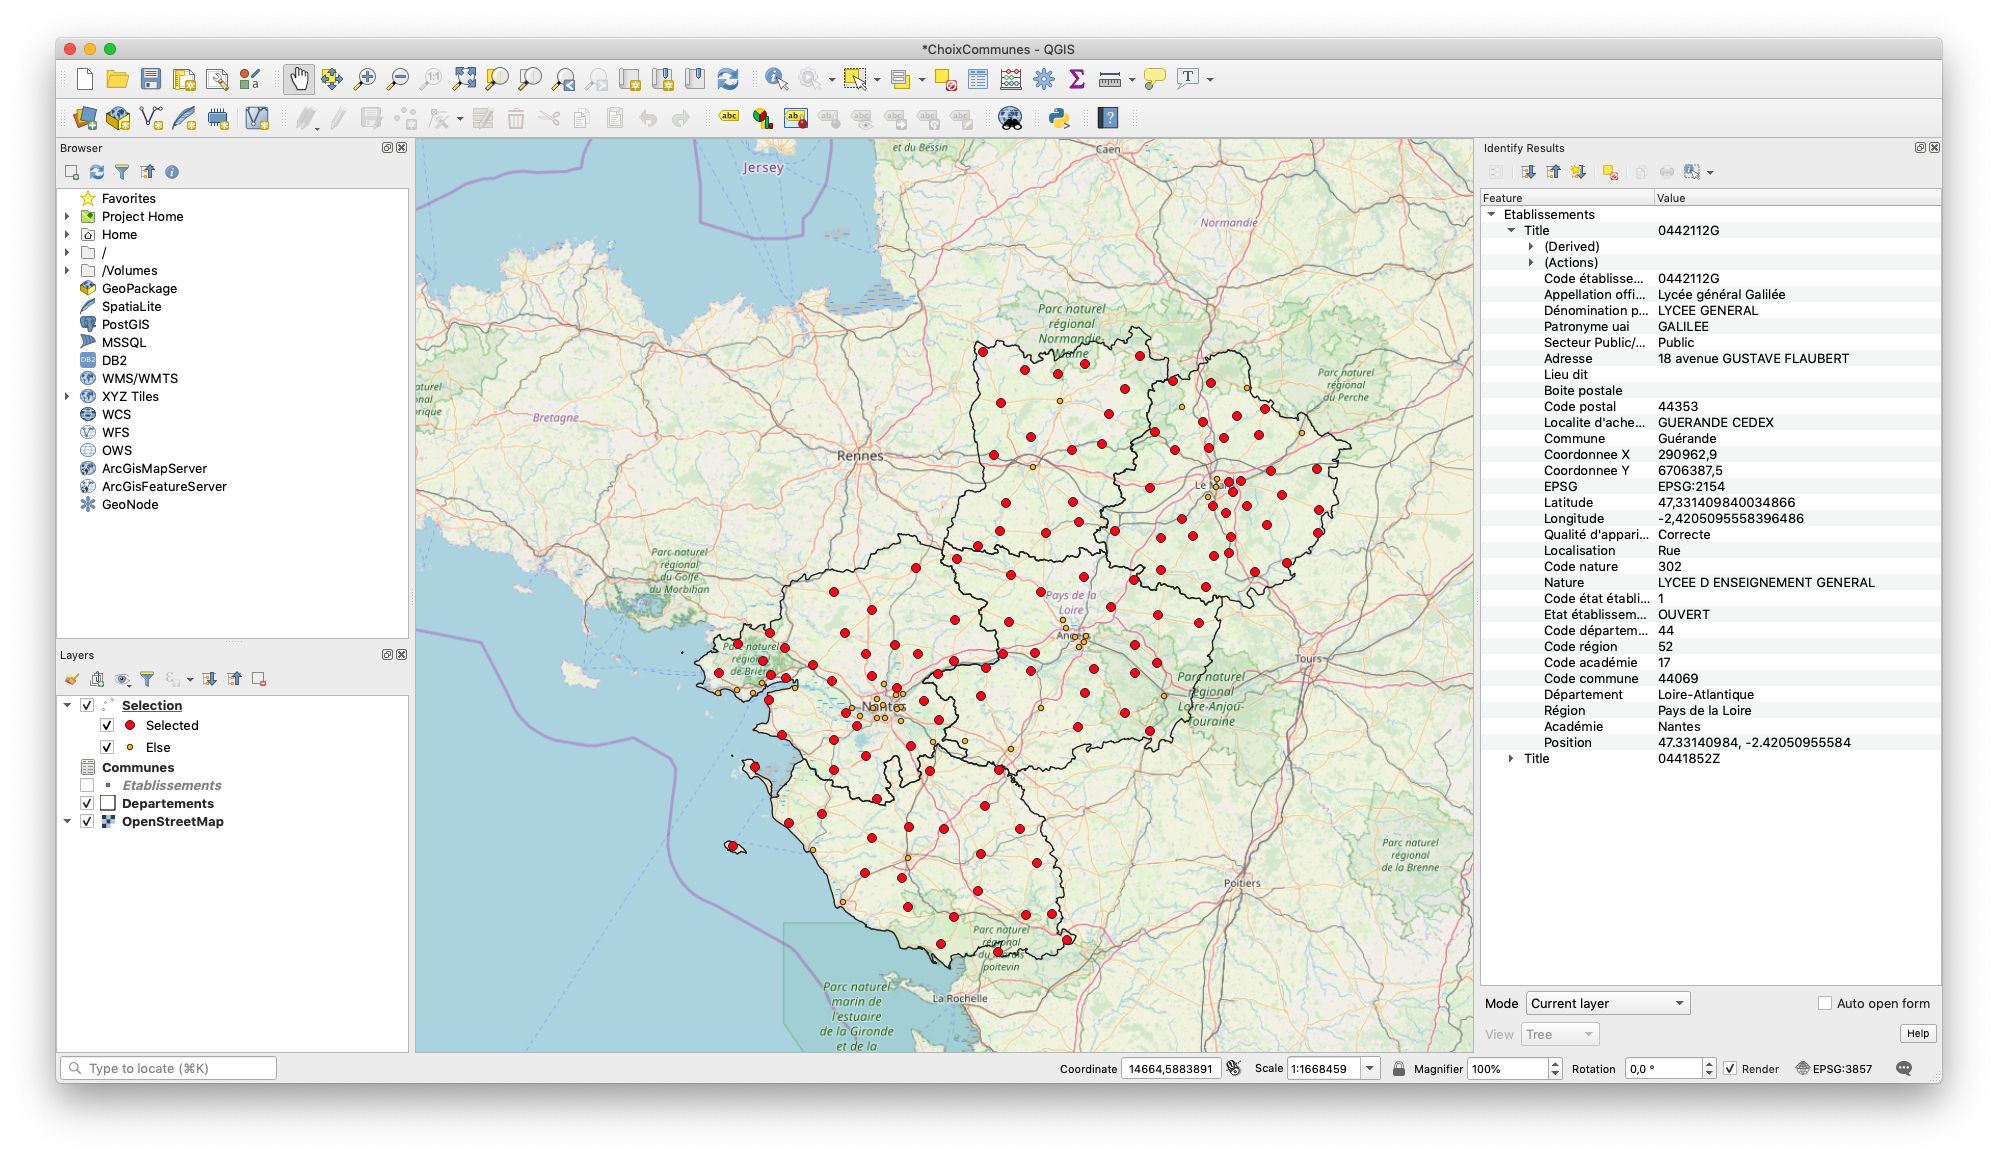
That’s quite of lot of places to choose from! To find out how to filter the data, explore the features by clicking on some points with the Identify Features tool.
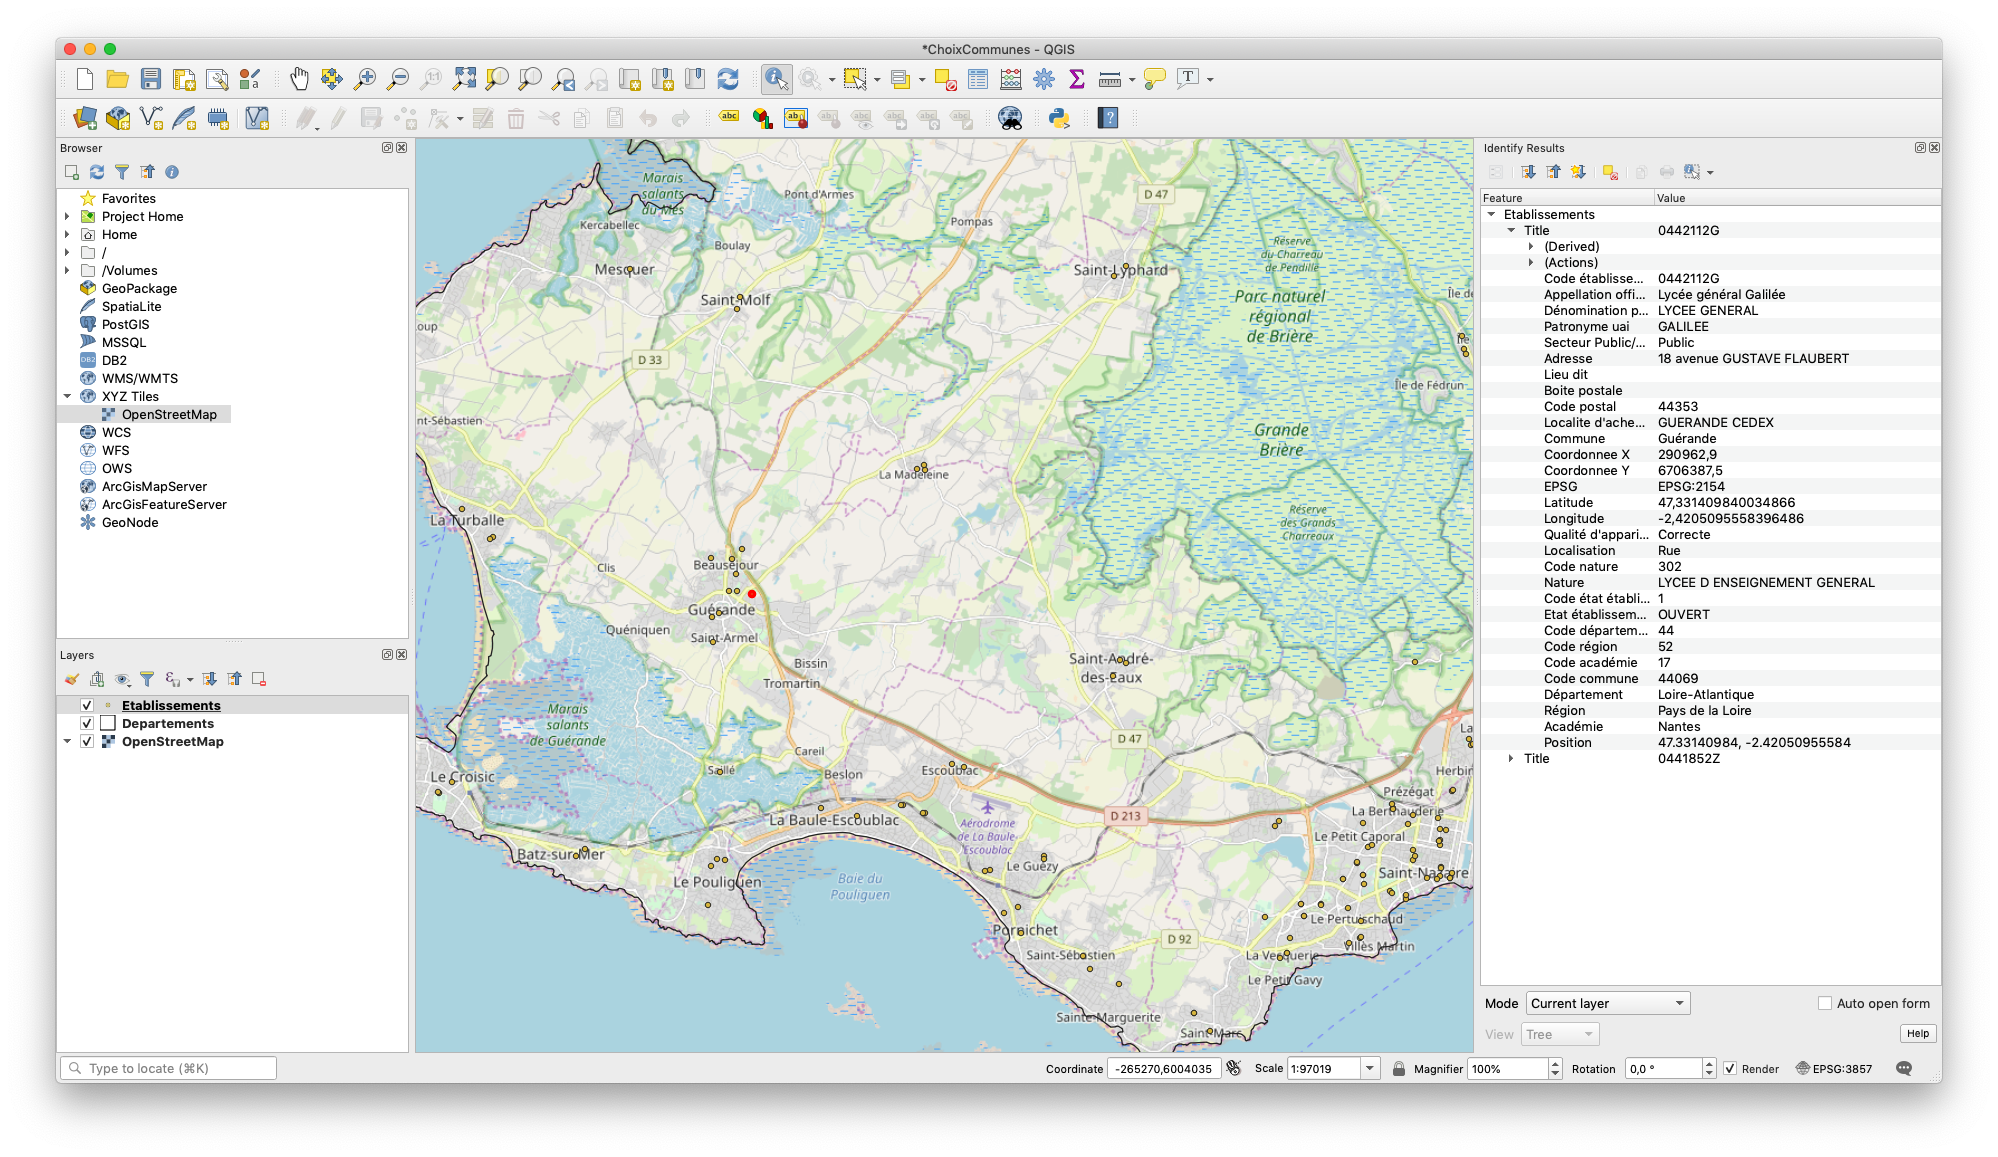
Those fields include (in French) the school level, region, public/private sector and city. Add a new virtual layer to select applicable schools and group them by the city:
- Go to
Layer / Create Layer / New Virtual Layer.... -
Select data with an SQL query.
SELECT Commune, st_pointonsurface(st_union(geometry)) FROM Etablissements WHERE `Code académie` = 17 AND `Secteur Public/Privé` = "Public" AND (`Code nature` = 302 OR `Code nature` = 340) GROUP BY Commune st_pointonsurface(st_union(geometry))is used to compute a centroid when more than one school belongs to one city.- Add the layer and hide the previous one, to display all the applicable cities.
- This layer will be referred as
Communesin the following instructions.
Joining with a population dataset
Now you have a layer showing a point for each applicable city. To filter out big and dense cities, you will join its data with some city population data:
- Export data as CSV2 and import it in QGIS as a Delimited Text Layer.
- Select
No geometryin theGeometry Definitionimport option, since we will not use this part of the data. - Click on
Joinsin theCommuneslayer properties. - Add a new one and match data based on the city name.
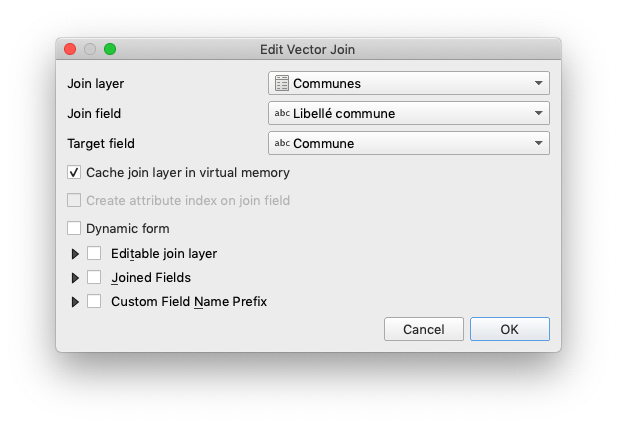
- Fields from the dataset containing population now appears for each point we plotted previously. By default those fields will have impractical names. You can rename them in
Attribute Form. - Use
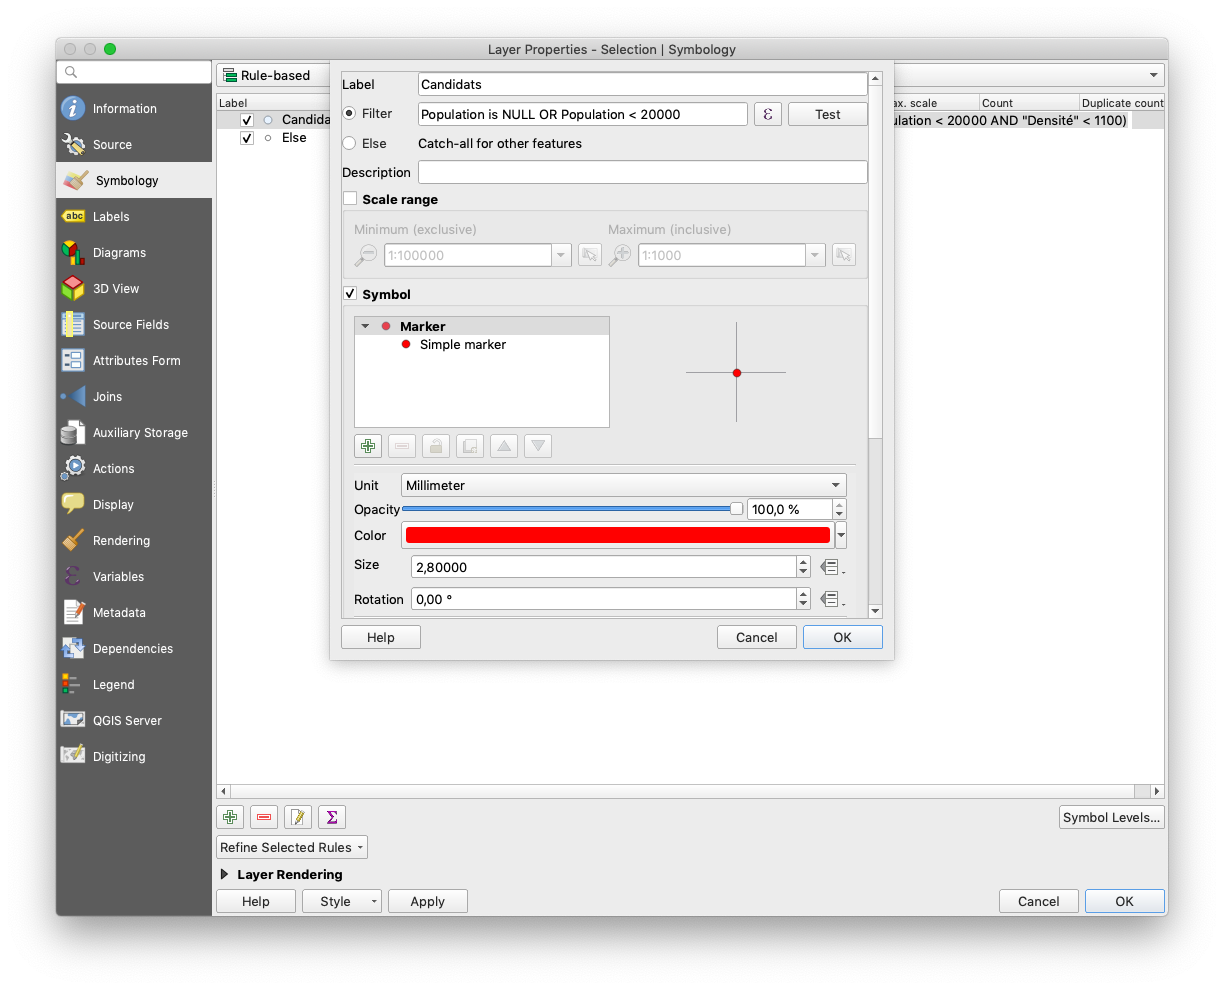
Rule-basedin theSymbologylayer properties. It allows you to customize the symbols depending on data conditions. - Make the small cities pop out with a rule like
Population < 20000 OR Population is NULL. - Note: Population is NULL for some fields because of mismatches between city names in the datasets, here mismatches are shown like small cities.
Computing distance to ocean
You just joined data from another dataset. When you need something which is not readily available, you can compute it. Here, you want to filter cities near the ocean or near train stations.
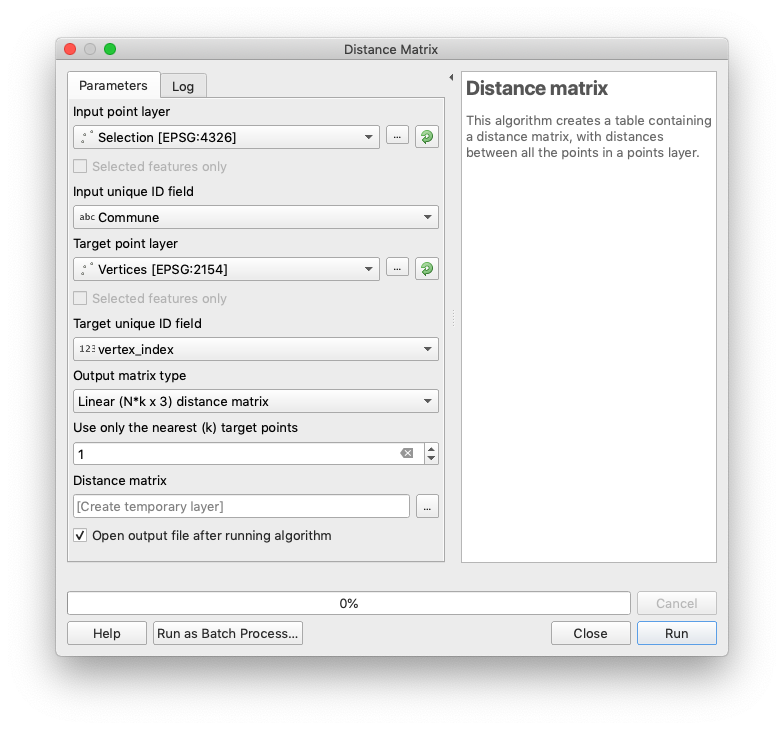
Use the Distance Matrix tool, which will match points from a dataset to the closest points of another one:
- Import data outlining the coast, like a coastal trail.3
- The Distance Matrix tool uses point inputs. You can extract those with
Vector / Geometry Tools / Extract Vertices.... - Then compute the distance between each city and the closest point to the coastal path with
Vector / Analysis Tools / Distance Matrix.... - Use
1target point. More would create a table with k entries for the k nearest points to the coast for each city, which does not make sense here. - Save the newly computed layer to make it permanent.
Repeat the same process with the train station locations,4 and join the whole as you like with the Communes layer.
Show hiking data from OpenStreetMap
I struggled to find hiking trails across the whole region from institutional sources, which was a good opportunity to import some data from OpenStreetMap:
- Export the Pays de la Loire region from GEOFABRIK as .osm.pbf, which is about 300 MB at the time.
- Import it as a vector layer in QGIS, select
multilinestringswhich contains routes. - Right click on the layer name and chose
Filter.... - Most of the route tags are stored in the
other_tagsfield, which is not really practical to filter. Enterother_tags LIKE '%hiking%'to display what should be hiking routes. - At this point everything became laggy on my laptop. I think the proper way to use this amount of data would be to import it in a local database instead of using a plain export as a virtual layer.
Data about interesting places and activities
Other interesting data to add to the map:
- activities attracting tourists5
- festivals and events6
- restaurants7
- cultural heritage8
- small charming cities9
- protected areas protected because of the interest of fauna and flora10 11
Datasets
-
Adresse et géolocalisation des établissements d’enseignement du premier et second degrés, Ministère de l’Education nationale, 2019-02-18, Etalab. ↩
-
Communes des Pays de la Loire, Région des Pays de la Loire, 2018-02-14, ODbL. ↩
-
Sentier du littoral 2012, Ministère en charge de l’environnement, 2015-09, Etalab. ↩
-
Référentiel des gares de voyageurs, SNCF Gares & Connexions, 2018-09-17, SNCF Open Data. ↩
-
Activités touristiques en Pays de la Loire, 2016-11, e-SPRIT, ODbL. ↩
-
Fêtes et manifestations en Pays de la Loire, 2016-11, e-SPRIT, ODbL. ↩
-
Restaurants en Pays de la Loire, 2018-03, e-SPRIT, ODbL. ↩
-
Lieux de patrimoine culturel en Pays de la Loire, 2016-11, e-SPRIT, ODbL. ↩
-
Petites cités de caractère en Pays de la Loire, 2017-10, Région des Pays de la Loire, ODbL. ↩
-
( ZNIEFF ) Zones Naturelles d’Intérêt Écologique, Faunistique et Floristique de type I en Pays de la Loire, 2019-04, DREAL Pays de la Loire, Etalab. ↩
-
( ZNIEFF ) Zones Naturelles d’Intérêt Écologique, Faunistique et Floristique de type II en Pays de la Loire, 2019-04, DREAL Pays de la Loire, Etalab. ↩